Group project for Introduction to Computational Fluid Dynamics class.
Groupmates: Matheus Pareja, Caleb Malinowski
Below is a snippet from the full 34 page report
Results: Turbulent Simulation
After running the simulation on the aforementioned idealized mesh, the following results were obtained
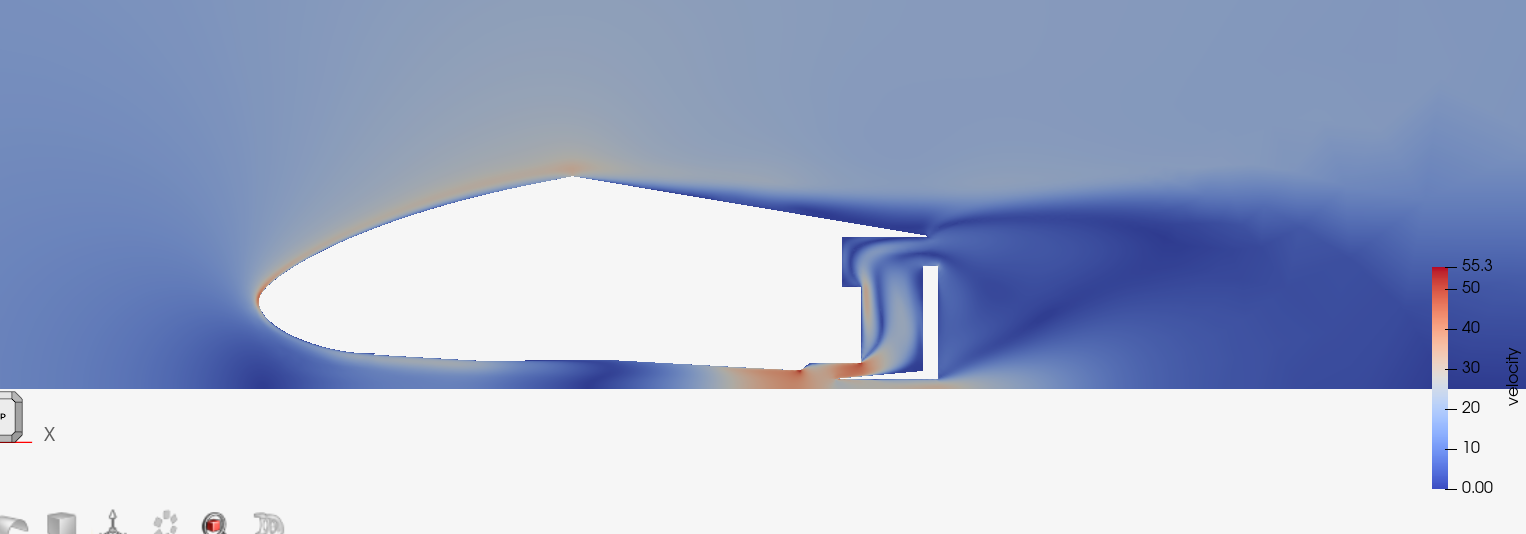
Simulation Results: Velocity Magnitude
The figure above displays the contour map of the magnitude of velocity through the simulation geometry. Here, the maximum magnitude of velocity is 55.3 m/s which is approximately 4.5 times the free stream velocity of 13 m/s. To make sense of this increase, measurements were taken on ratio of height from the ground plane to the underside of the vehicle against the overall height of the model. This ratio was approximately 4.6. Extrapolating from these results, it is expected for the velocity to increase by 4.6 times in the reduced area section underneath the vehicle, where the maximum velocity magnitude is located. Since the maximum simulation velocity magnitude was 4.5 times the free stream velocity, a good agreement is observed between these theoretical and experimental velocity magnitude values.
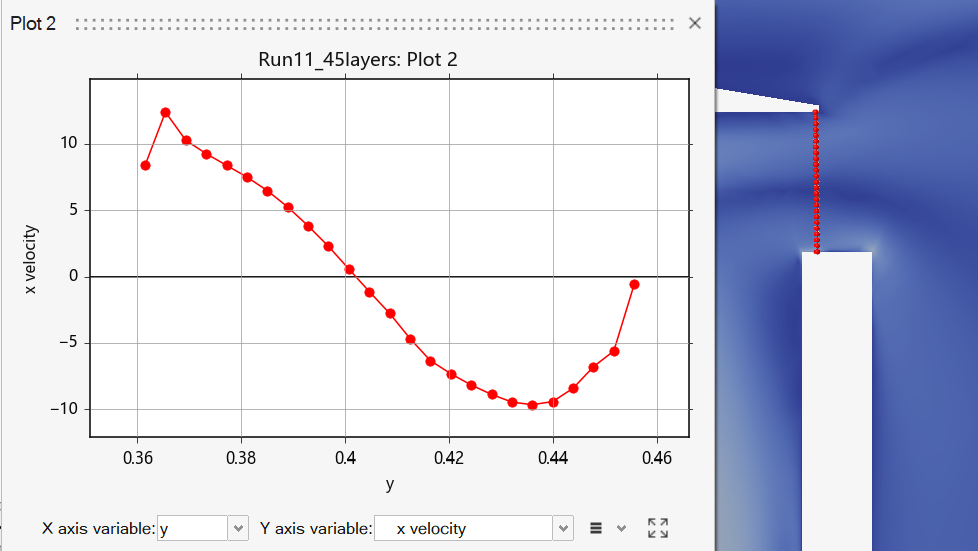
Simulation Results: Velocity Profile of Exit
Further analysis was done regarding the exit velocity of the area of interest for this simulation as can be seen in the figure above. Here, the velocity profile in the x direction across the entire exit is plotted, with the points shown on the contour plot. From this we can see that most of the air is leaving towards the bottom of this opening with an exit speed of approximately 13 m/s. This velocity decreases as the points move further away from this bottom location, and at the approximate midpoint the flow begins to change direction and enter the battery containment area resulting from the junction of velocity of air over the car and the presence of an eddy, as demonstrated by the streamlines in the figure below.
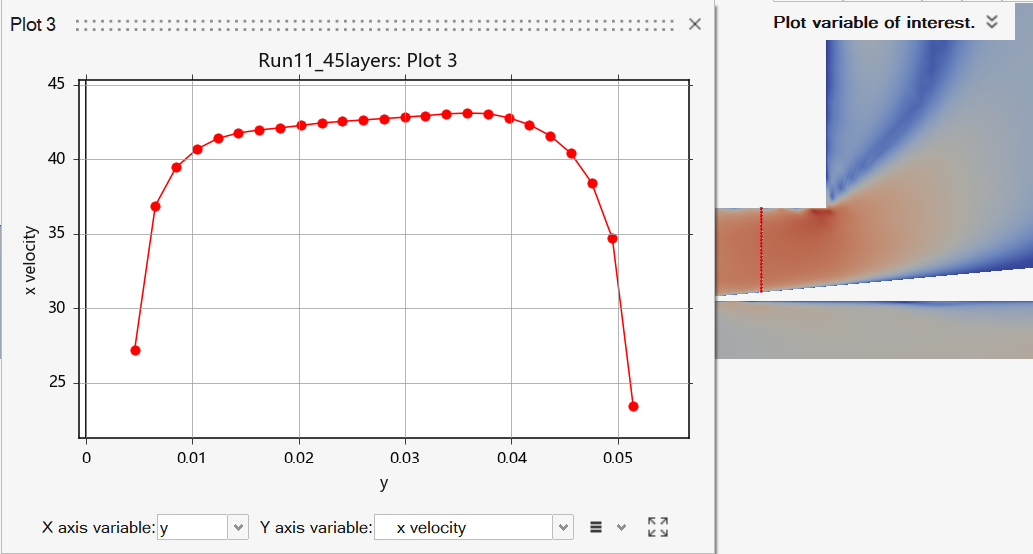
Simulation Results: Velocity Profile of Inle
The x direction velocity profile at the inlet of the battery containment was also analyzed for completeness as seen in the figure above Here, the inlet velocity is essentially uniform at about 42-43 m/s, with major reductions near both walls due to the imposed no slip condition on these surfaces.
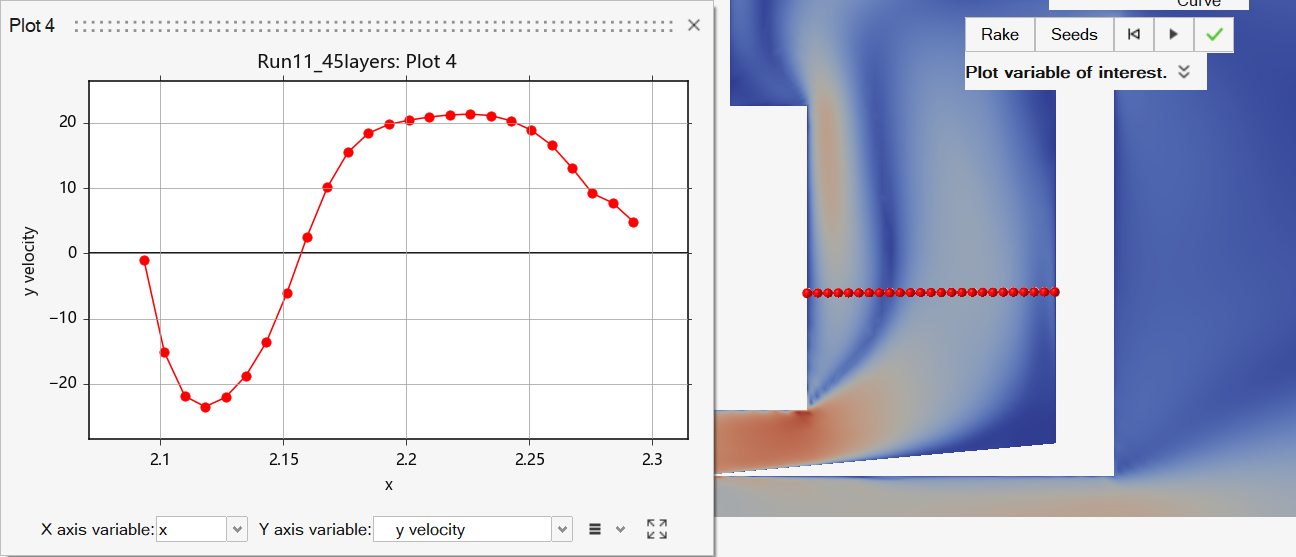
Simulation Results: Velocity Profile in Battery Area
Lastly, the velocity profile within the battery box was examined. In this case, the y component was of interest. From the presence of eddies, flow direction near the left side boundary was down (negative y direction), and starting at x = 2.16 the flow direction transitioned to upward (positive y direction). A maximum upward flow velocity was reported to be 21.328 m/s, and was located at x = 2.226m. However, roughly uniform flow of approximately 20 m/s was found to exist between x = 2.2 through 2.25 m.
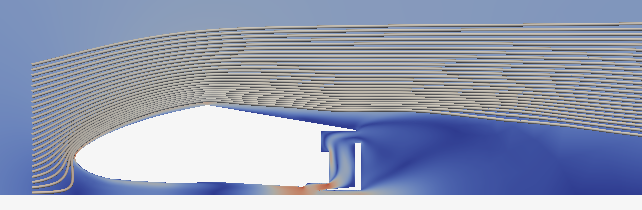
Simulation Results: Streamlines Over Geometry
From the figure above the flow of air over the top of the vehicle can be visualized. Through iterations on the total amount of layers, an accurate depiction of flow was achieved. Although this does not specifically model the area of interest for this project, the use of these streamlines helped to set the proper surface edge layers for the entire geometry. From comprehensive review of similar simulations on simplified vehicular cross sections, an agreement was discovered between the paths of streamlines over this specific model, and those from the review.
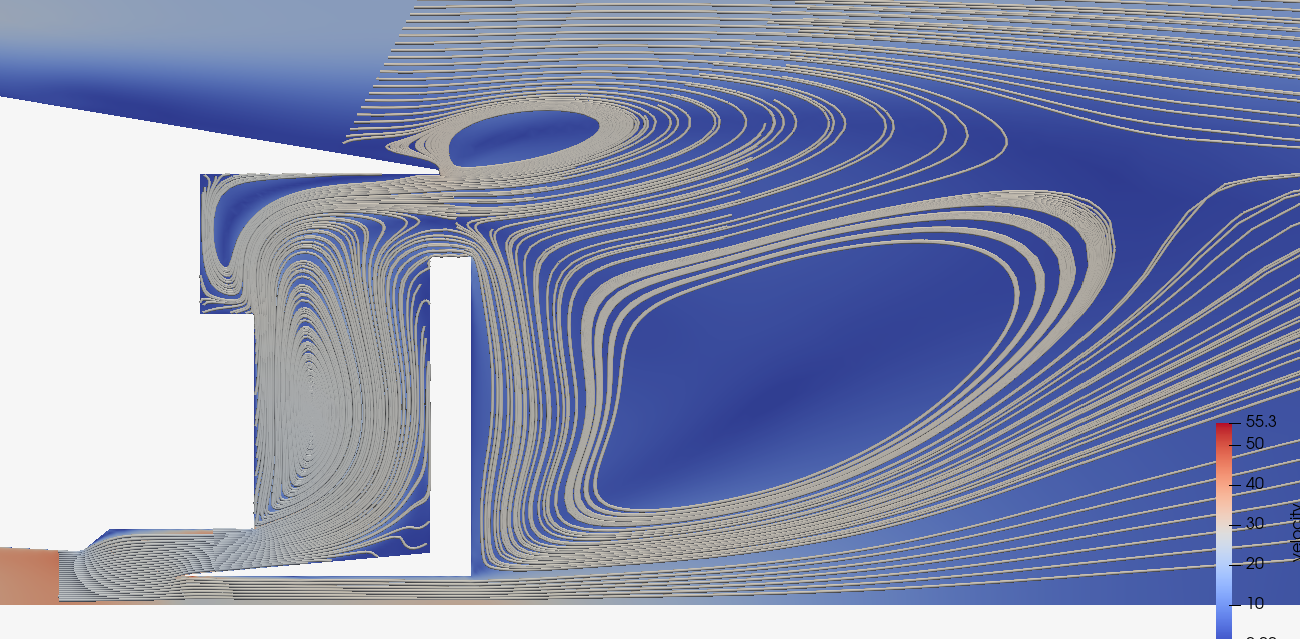
Simulation Results: Streamlines Through Area of Interest
The figure above visualizes the path of air through the area of interest for this simulation, or the battery containment area. The presence of two distinct turbulent eddies, within the battery box, are displayed. Through animation of individual streamlines, it was determined that the larger eddy within this area is rotating in a counter-clockwise direction, and from knowledge of fluid behavior it was extrapolated that the smaller eddy, located in the top left region of the battery box, is rotating in the opposite direction, or clockwise. This is due to the shearing force between the two eddies, as the fluid must be moving in the same direction in the contact region. Furthermore, from these streamlines the exit behavior can also be visualized. The air is leaving this area near the top and bottom bounds of the exit opening. The air leaving at the top joins with the flow over the vehicle to form another eddy above the car, whereas the air leaving from the bottom of the opening flows down the rear surface of the vehicle, where it joins with the flow between the bottom of the vehicle and the ground plane.